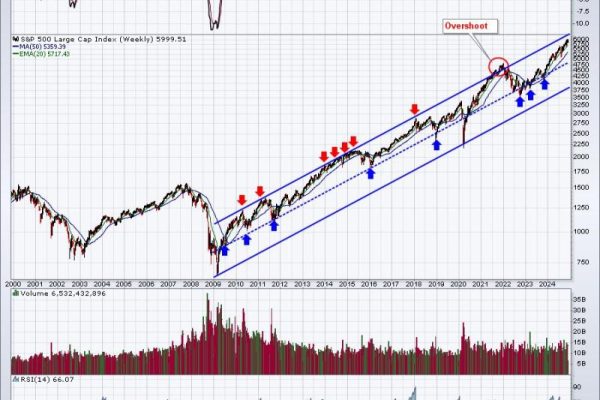
Can the S&P 500 Rally Without Tech?

In this video from StockCharts TV, Julius takes a deep dive into US sector rotation, breaking it down into offensive, defensive and cyclical sectors. He first looks at the relative rotations that are shaping up inside the group, assessing each sector’s price chart in combination with the rotation on the Relative Rotation Graph to get…

Read More

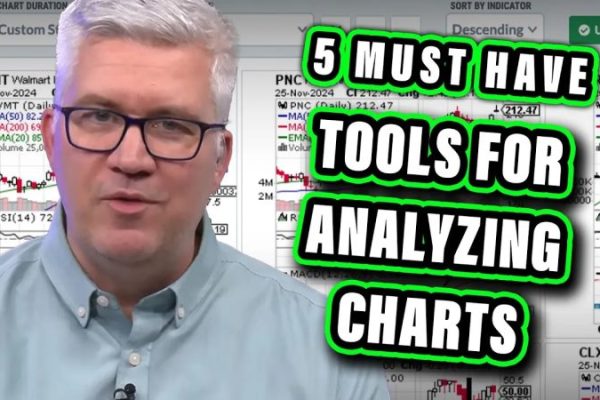
Five Must-Have Tools for Analyzing Stock Charts

In this video, Dave shares how he uses the powerful ChartLists feature on StockCharts to analyze trends and momentum shifts as part of his daily, weekly, and monthly chart routines. He shows how mindful investors can use ChartLists to identify inflection points, focus on top performers, analyze performance trends, and better understand market correlations. Don’t…

Read More

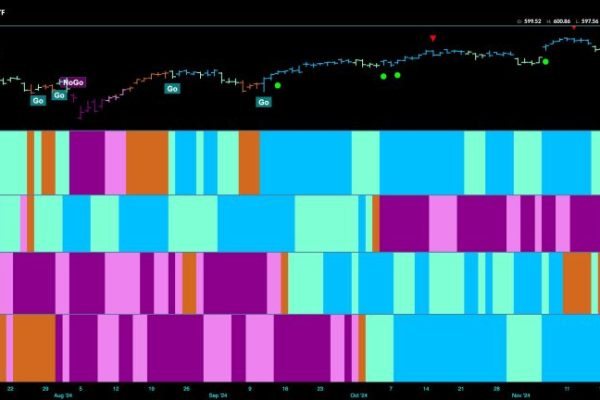
The Finances Look Good For Equity Trend

Good morning and welcome to this week’s Flight Path. The “Go” trend in equities has proved to be resilient as we saw strong blue “Go” bars return this week. Treasury bond prices remained in a “NoGo” although this week we did see weaker pink bars as the trend showed weakness. U.S. commodities painted strong blue “Go”…

Read More
Back To Top